
- This topic has 2 replies, 1 voice, and was last updated 5 months, 2 weeks ago by
Fabio.
-
AuthorPosts
-
-
February 11, 2026 at 4:21 am #407
Fabio
Keymaster -
February 11, 2026 at 4:36 am #410Keymaster
There are 2 ways to analyze the conversations between your visitors and Fabio AI ChatBot : by consulting the analytic page and by downloading the conversations on your local machine.
1- Analyzing the conversations directly on the analytic page.
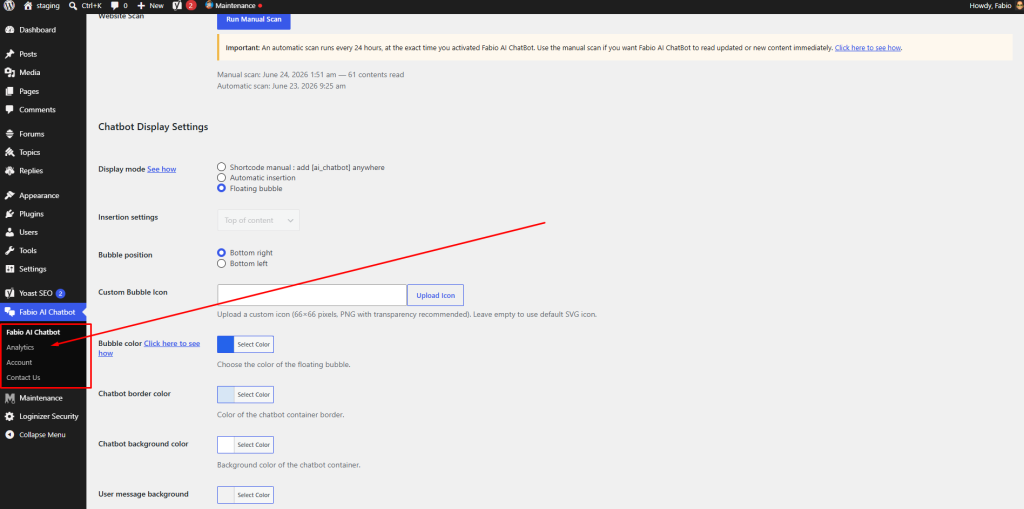
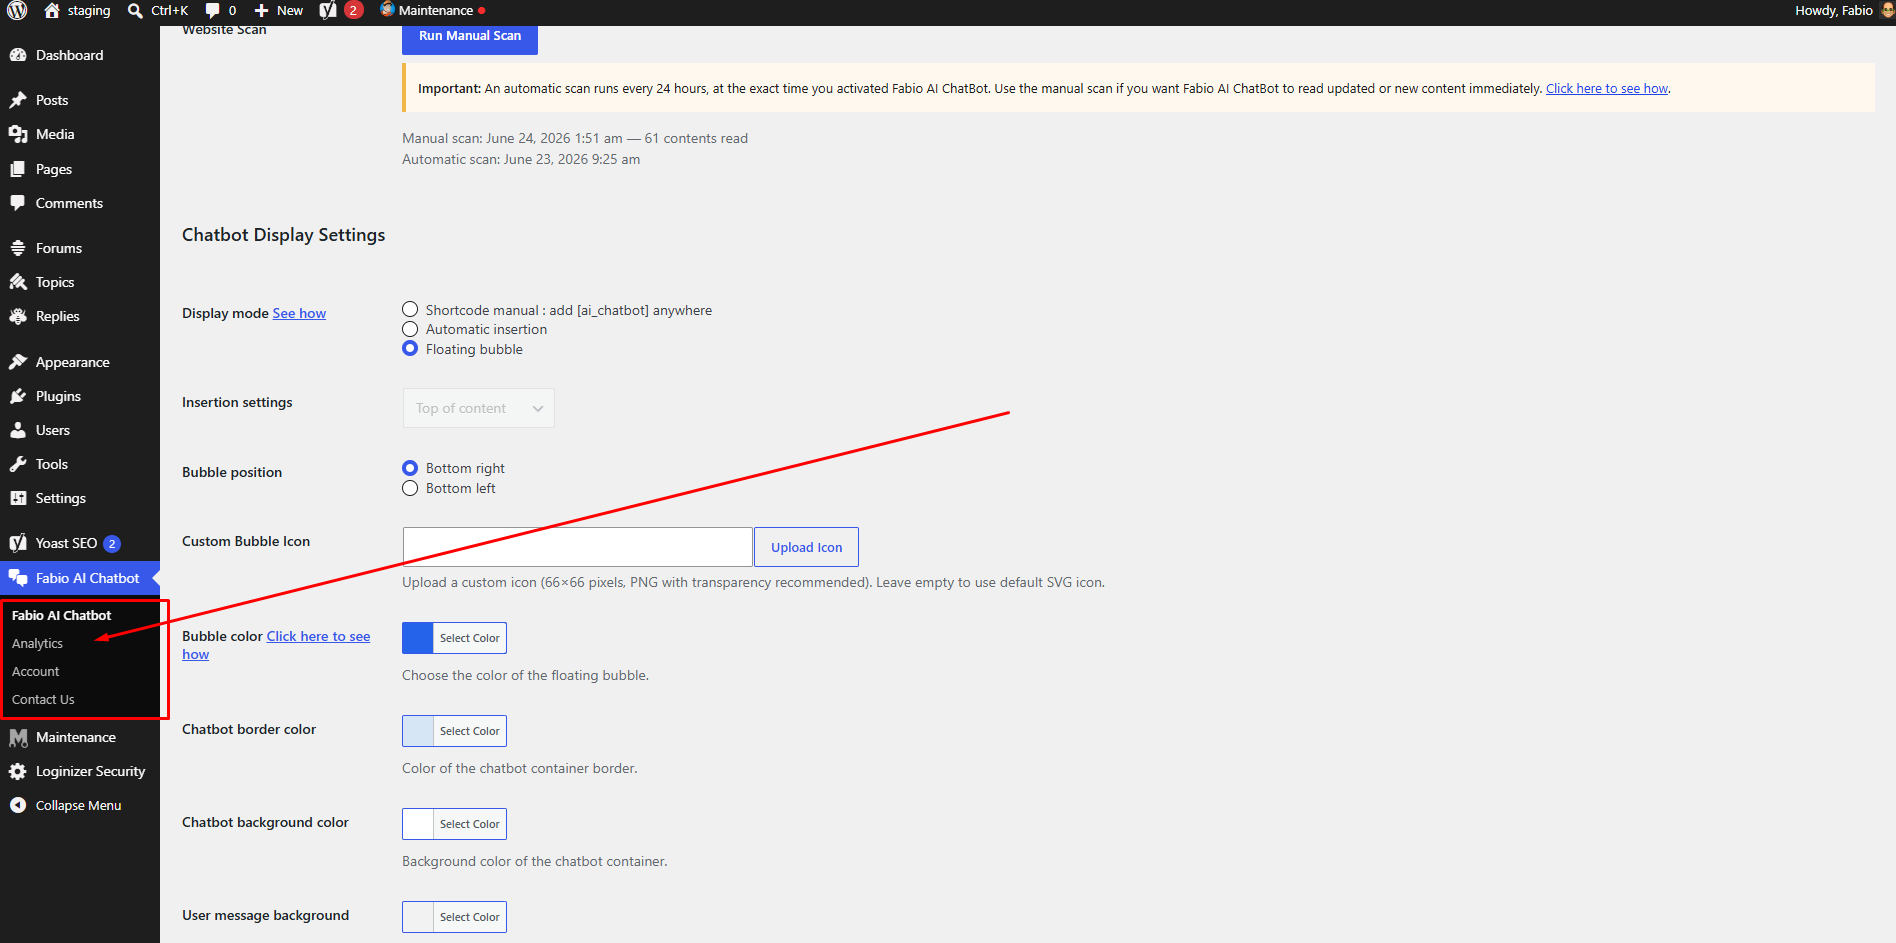
Begin by viewing our how to video here, then go to your WordPress backend, and look for “Fabio AI Chatbot” in the left barre menu. Pass your mouse on “Fabio Ai Chatbot”, you will see a dropdown menu with an option for “Analytics”. Click on “analytics”, it will guide you to the analytic page.
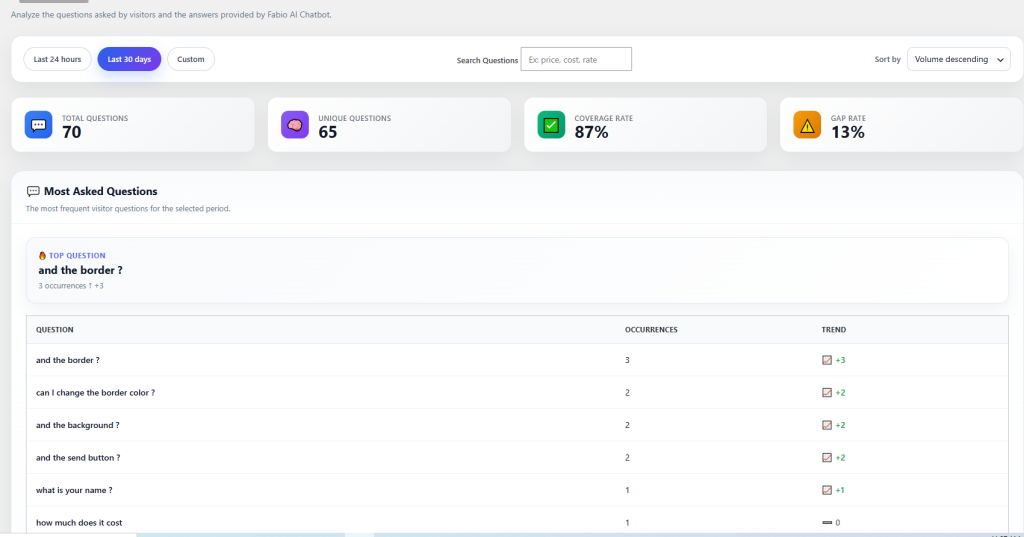
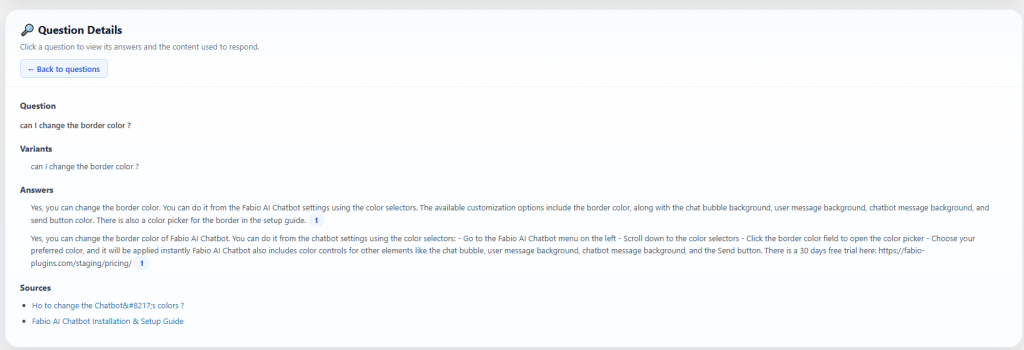
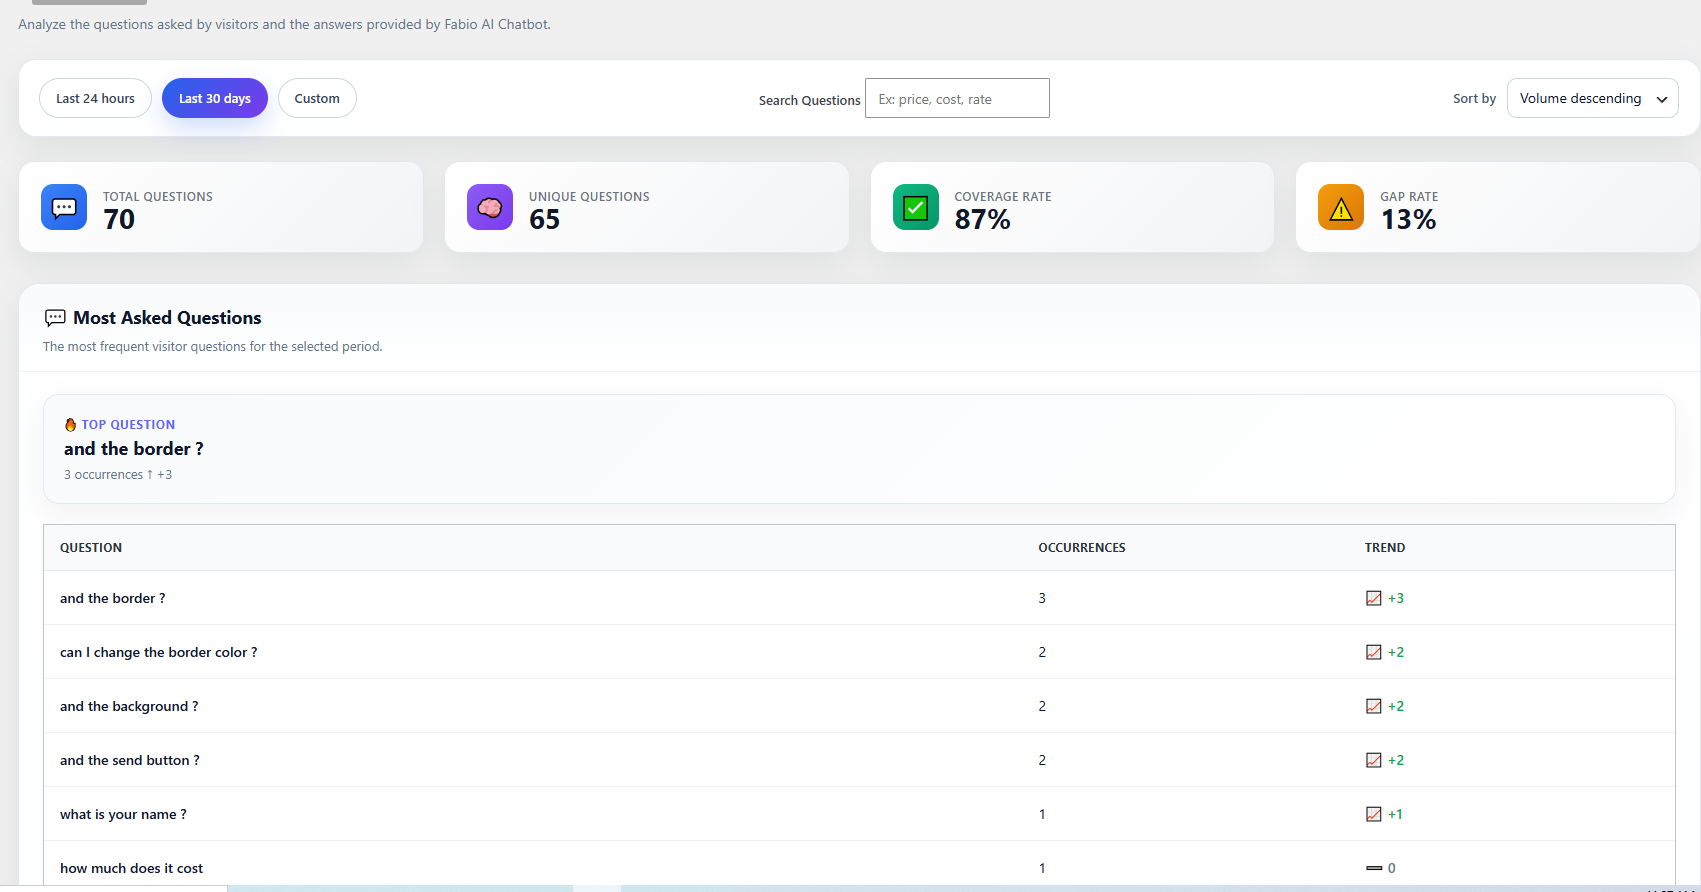
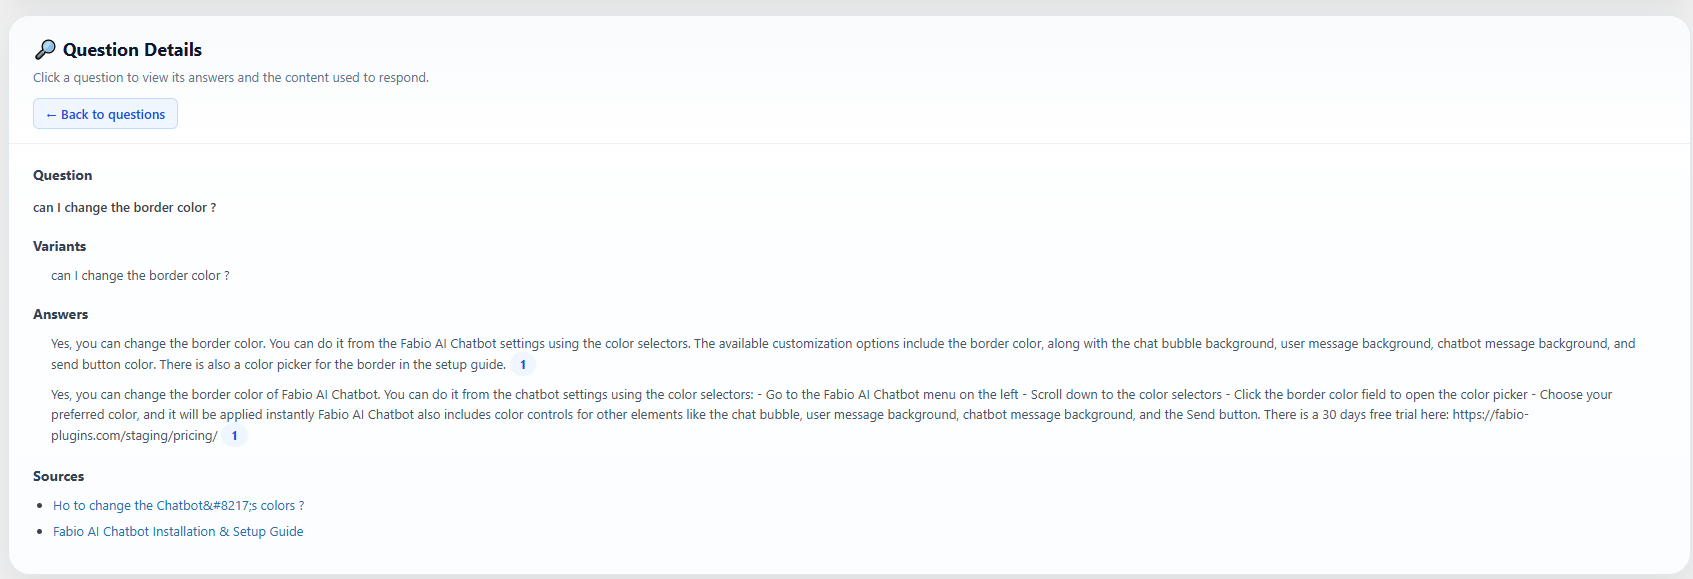
On this analytics page, you can review all questions asked by your visitors, along with the answers and sources provided by Fabio AI Chatbot. You can select questions within a specific date range or filter them by one or more keywords. Click on any question, and the screen will scroll down to the corresponding answer from Fabio AI Chatbot, allowing you to assess whether your content provides the correct information.
With these analytics, you can easily identify if certain information should be more prominent in your content and update the relevant pages accordingly.
2- Analyzing the conversations by downlaoding all on a csv and passing the csv in your own AI
Fabio AI ChatBot allows you to download all conversations from their database, which also empties this database. This allows you to identify the most frequently asked questions, the questions that take the longest to answer, and other useful insights.
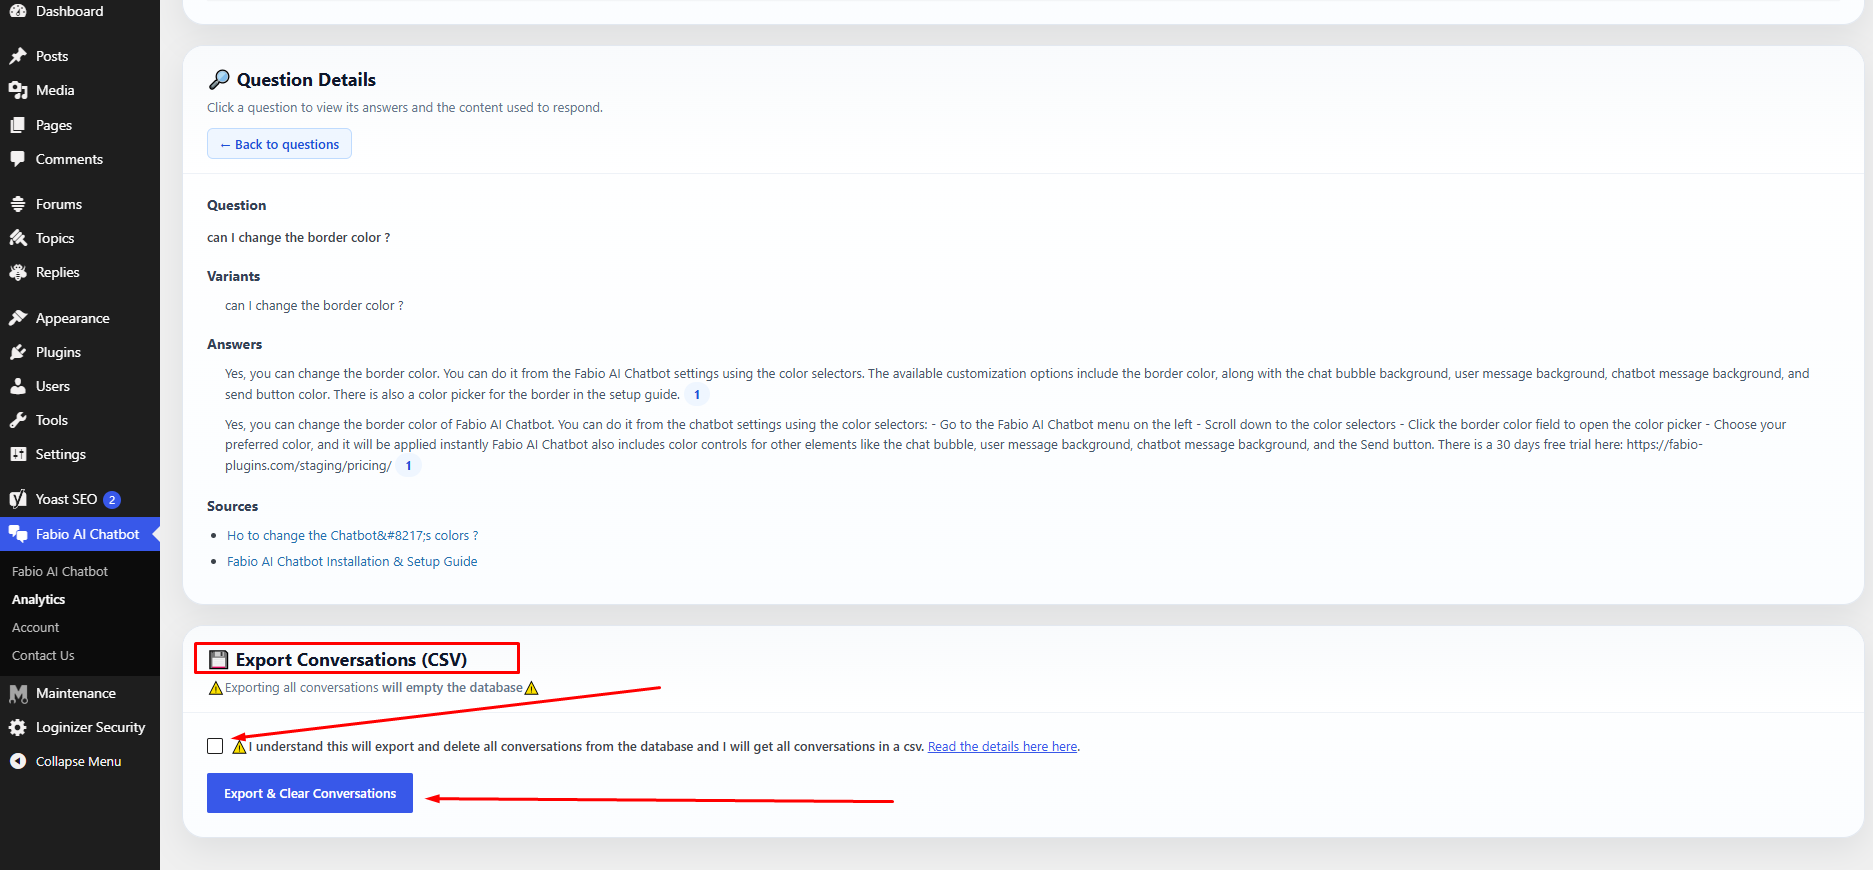
1 — Go to the plugin admin.
Click “Download and clear database after export”, then click the button “Download conversations (CSV)”.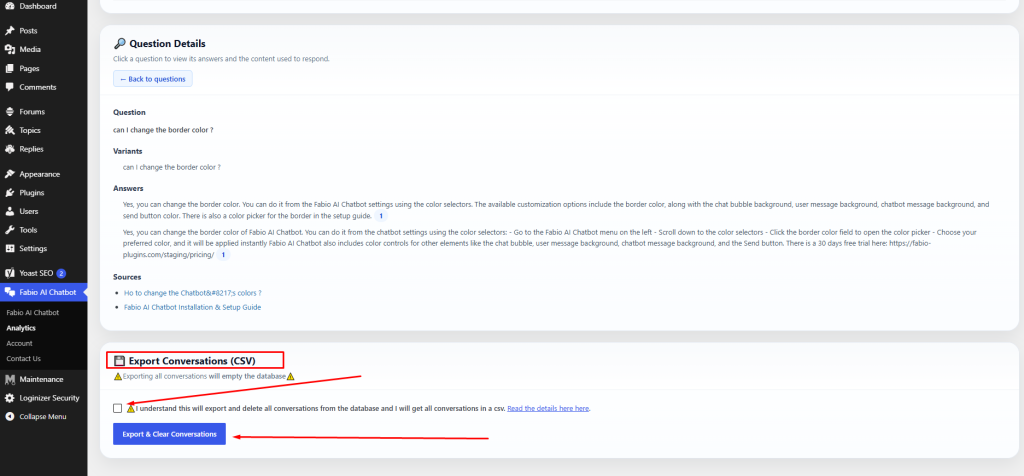
2 — The export will download and clear the conversation database.
After the export, the conversation database is automatically emptied to reduce server resource usage. The CSV file will look like this: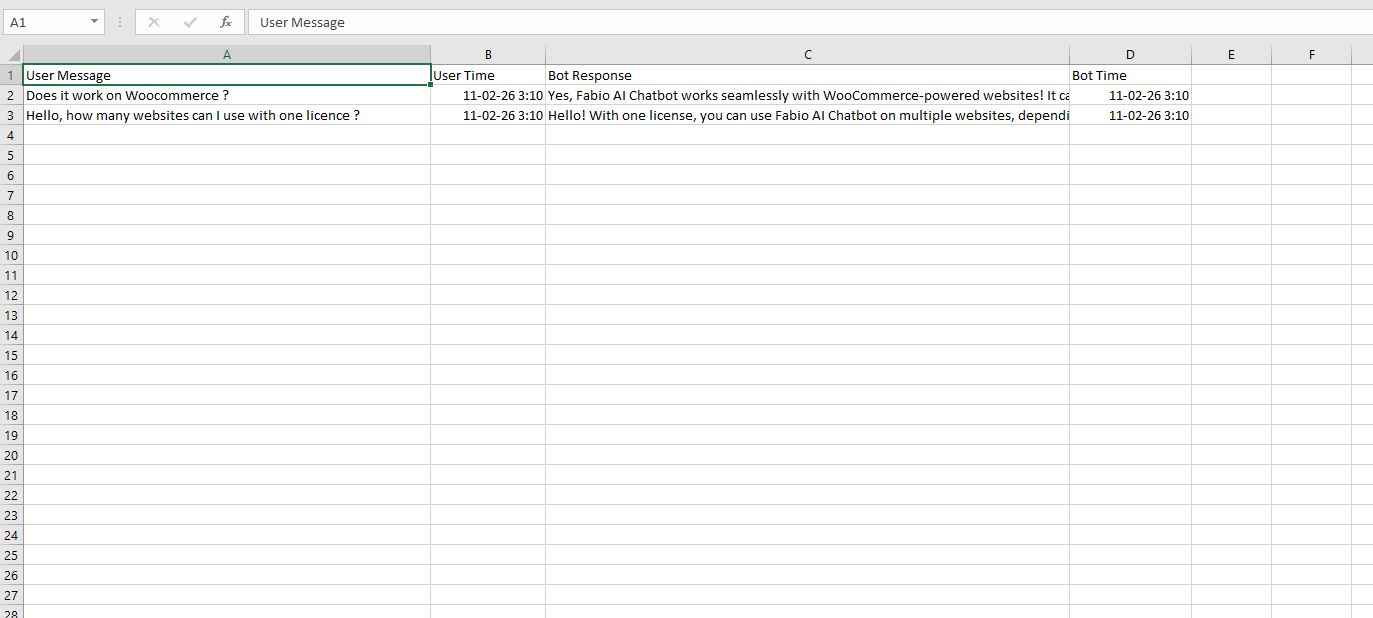
3 — Upload the CSV file to any AI tool and use a prompt like the one below:
I have exported a CSV file containing conversations between visitors and my website chatbot.

The CSV contains user messages and chatbot replies.

Your task is to analyze this file and provide:

- The most frequently asked questions or topics (group similar questions together)
- The questions that take the longest to answer
- The top recurring user intents
- Any repeated problems, confusion, or unmet needs
- Content gaps on my website suggested by these questions
- Suggestions for new pages, FAQs, or improvements based on user demand
- A short executive summary of what visitors are mainly looking for

If possible:
- Categorize questions by theme
- Provide percentages or frequency estimates
- Highlight opportunities to improve conversions

Base your analysis only on the data inside the CSV.
Be structured, clear, and concise.
Why should you analyze these questions?
Because it helps you understand which questions your audience asks most often, and which answers the chatbot cannot find in your content.
If Fabio AI Chatbot cannot find an answer, it usually means the information is not clearly explained on your website.
When your analysis shows responses such as “I can’t find the answer in the content”, you should improve or expand the information related to that question on your site.
-
This reply was modified 7 months, 3 weeks ago by
-
This reply was modified 7 months, 3 weeks ago by
-
This reply was modified 4 months ago by
-
This reply was modified 4 months ago by
-
This reply was modified 4 months ago by
-
This reply was modified 3 months, 3 weeks ago by
-
This reply was modified 7 months, 3 weeks ago by
-
May 8, 2026 at 8:18 am #1022Keymaster
Here’s a prompt you can use to get a detailed infographic of what your visitors are looking for when they arrive on your site :
Create a vertical social-media infographic based on the analysis of my chatbot conversation CSV.
The goal of the infographic is to show that analyzing chatbot conversations helps website owners understand what their visitors really want.
Use only the data from the CSV.
Infographic title:
“Voice of Your Visitors”Subtitle:
“Real questions. Real insights. Real opportunities.”Design style:
Modern SaaS dashboard, clean white background, rounded cards, soft shadows, strong blue/purple/teal/orange accents, professional B2B look, easy to read on mobile.Include these sections:
1. Header
– Logo-style chatbot icon
– Title: “Voice of Your Visitors”
– Subtitle: “Real questions. Real insights. Real opportunities.”2. Key metrics
Show 3 or 4 KPI cards:
– Conversations analyzed
– Recurring themes found
– Top visitor priorities
– Main conversion opportunity3. Donut chart
Show the distribution of visitor question themes.
Include theme labels, counts, and percentages.4. Top visitor questions
Create a clean list of the most common grouped questions.
Add small icons and frequency counts.5. What these insights reveal
Create 4 to 6 small insight cards with icons.
Examples:
– Visitors are evaluating value and use cases
– Pricing examples are needed
– Setup and API keys create friction
– Support reassurance matters
– Content freshness matters
– Technical issues must be visible6. Longest or most complex answers
Show a mini horizontal bar chart.
If timestamps are unavailable, use reply length as a proxy and mention “by reply length”.7. Top content gaps
List the main missing content suggested by visitor questions.8. High-impact recommendations
Show 4 or 5 practical recommendations:
– Add a pricing calculator
– Create use-case landing pages
– Build an API key guide hub
– Strengthen support and onboarding
– Add FAQs based on real visitor questions9. Final banner
Add a strong final message:
“Your chatbot does more than answer questions — it reveals what your visitors need before they convert.”Make the infographic visually clear, compact, and suitable for LinkedIn or X.
Use icons, charts, short text, and strong visual hierarchy.
Do not overload the design with long paragraphs.
-
-
AuthorPosts
- You must be logged in to reply to this topic.